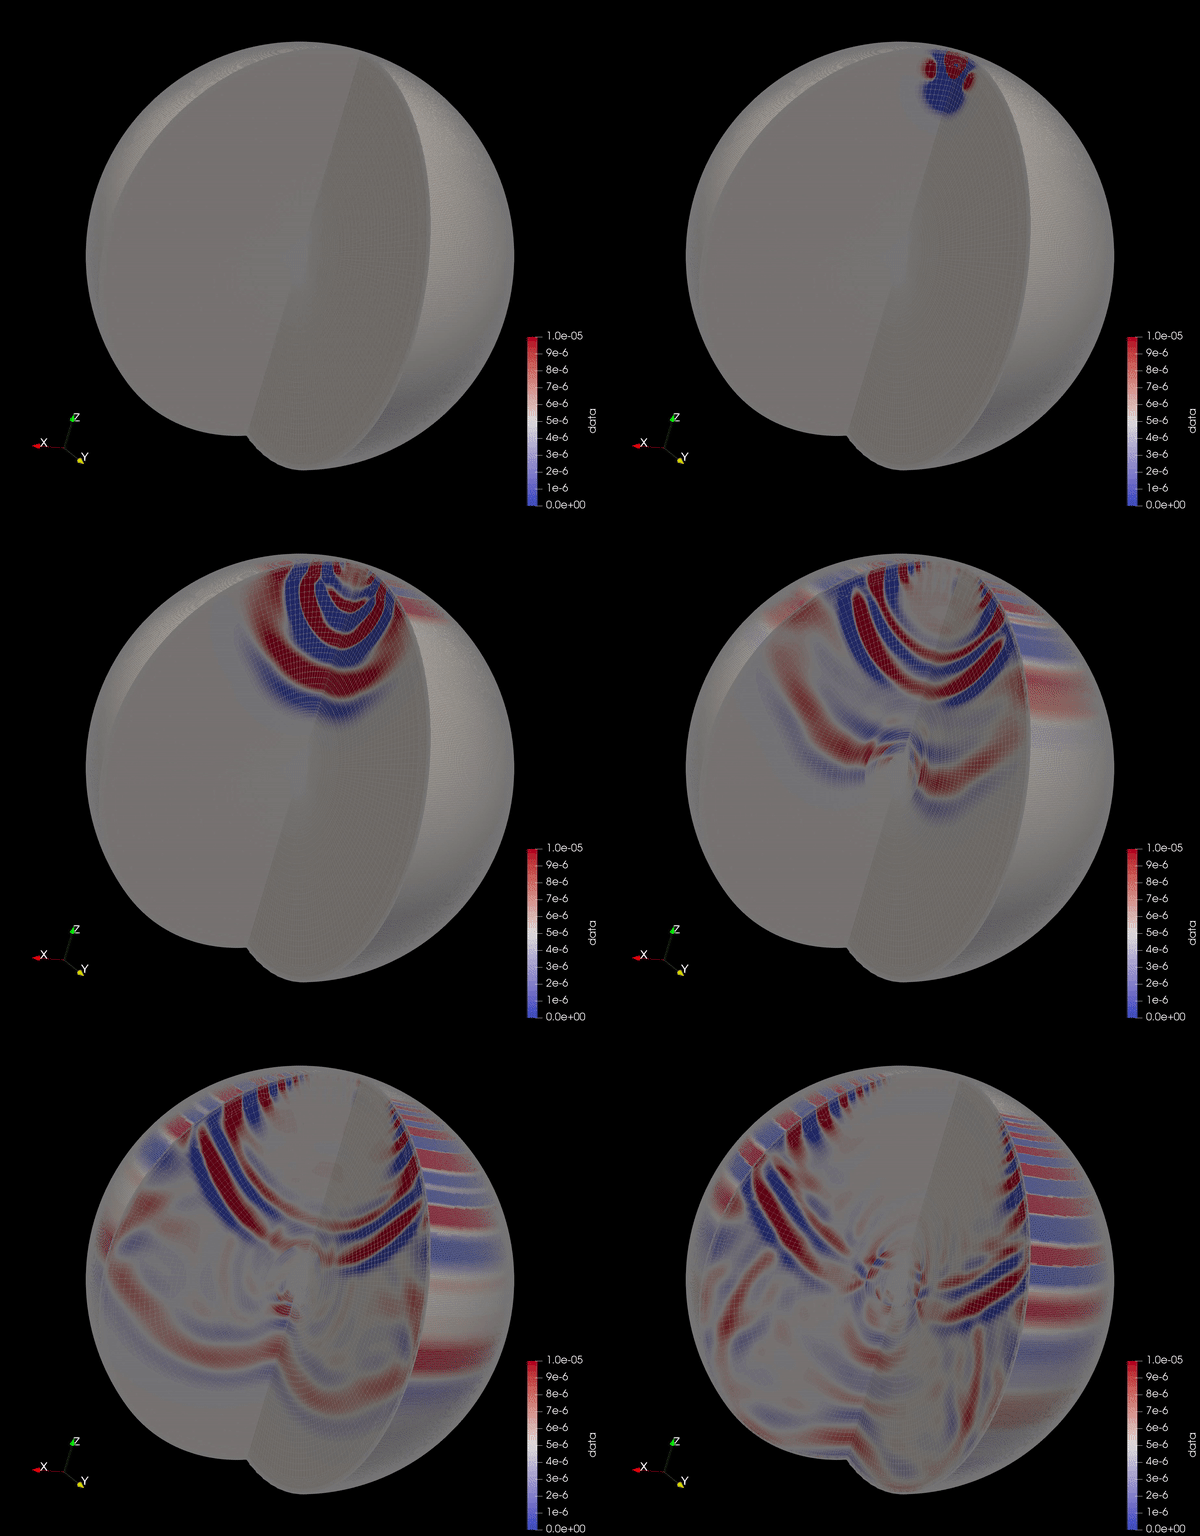
One of the most exciting aspects of modern geophysical research is our ability to
simulate physical phenomena with ever-increasing accuracy and speed. The development
of easily implementable numerical methods for the solution of partial differential equations,
as well as the availablity and power of modern computers, have made the solution of
equations like the seismic wave equation:
possible with even a modest laptop. Using the supercomputing resources at PICSciE, I can run
these simulations for increasingly detailed Earth models, down to frequencies of 1 Hz.
My research aims to harness the powers of these computational methods to further our
understanding of the interior structure of the Earth, as well as other planets. In addition,
I am broadly interested in numerical methods as a whole, since they exist at the
fascinating intersection of mathematics, computer science, and physics.
Seismic Imaging
When you go to the doctor to get an X-Ray, high frequency electromagnetic waves are
propagated through your bones and tissue to produce an image of your insides. Using the
same physical principles, seismologists use much lower frequency seismic waves to produce
images of the interior of the Earth. My research uses seismic data recorded by earthquakes
around the globe to map out the structure of the mantle, ranging from depths near the
Earth's surface all the way down to 1000 km.
In particular, I am interested in depths between 400 and 700 km, a region known as the
mantle transition zone. At these depths, olivine, a major mineral constituent of much of the
Earth's crust and mantle, undergoes multiple phase changes. Just as ice turns to liquid water
at certain pressures and temperatures, solid olivine transforms to its high pressure forms
due to the tremendous pressure at these extreme depths. Astonishingly, the signature of these
phase transitions can be observed in seismic images as two bright reflectors around 410 and 660
km depth (the solid red lines in the animation). By measuring the properties of these phase
transitions, we can get a sense of the variation of the temperature and pressure deep within the Earth.